Google Performance Max campaigns promised advertisers a unified, AI-driven approach to reaching audiences across every Google channel. But for performance marketers running social and app campaigns, PMax has introduced a new problem: when conversions drop, which channel is the culprit? And more importantly — after the click happens, why aren’t users converting?
In 2026, channel-level CVR visibility within PMax has improved dramatically. This guide shows you exactly how to read PMax channel performance data, isolate drop-off points by channel, and apply post-click optimization to recover revenue you’re currently leaving on the table.
→ If you’re already looking for a fix, Book a Free Demo and our team will audit your post-click funnel for free.
What the PMax Channel Timeline Actually Reveals
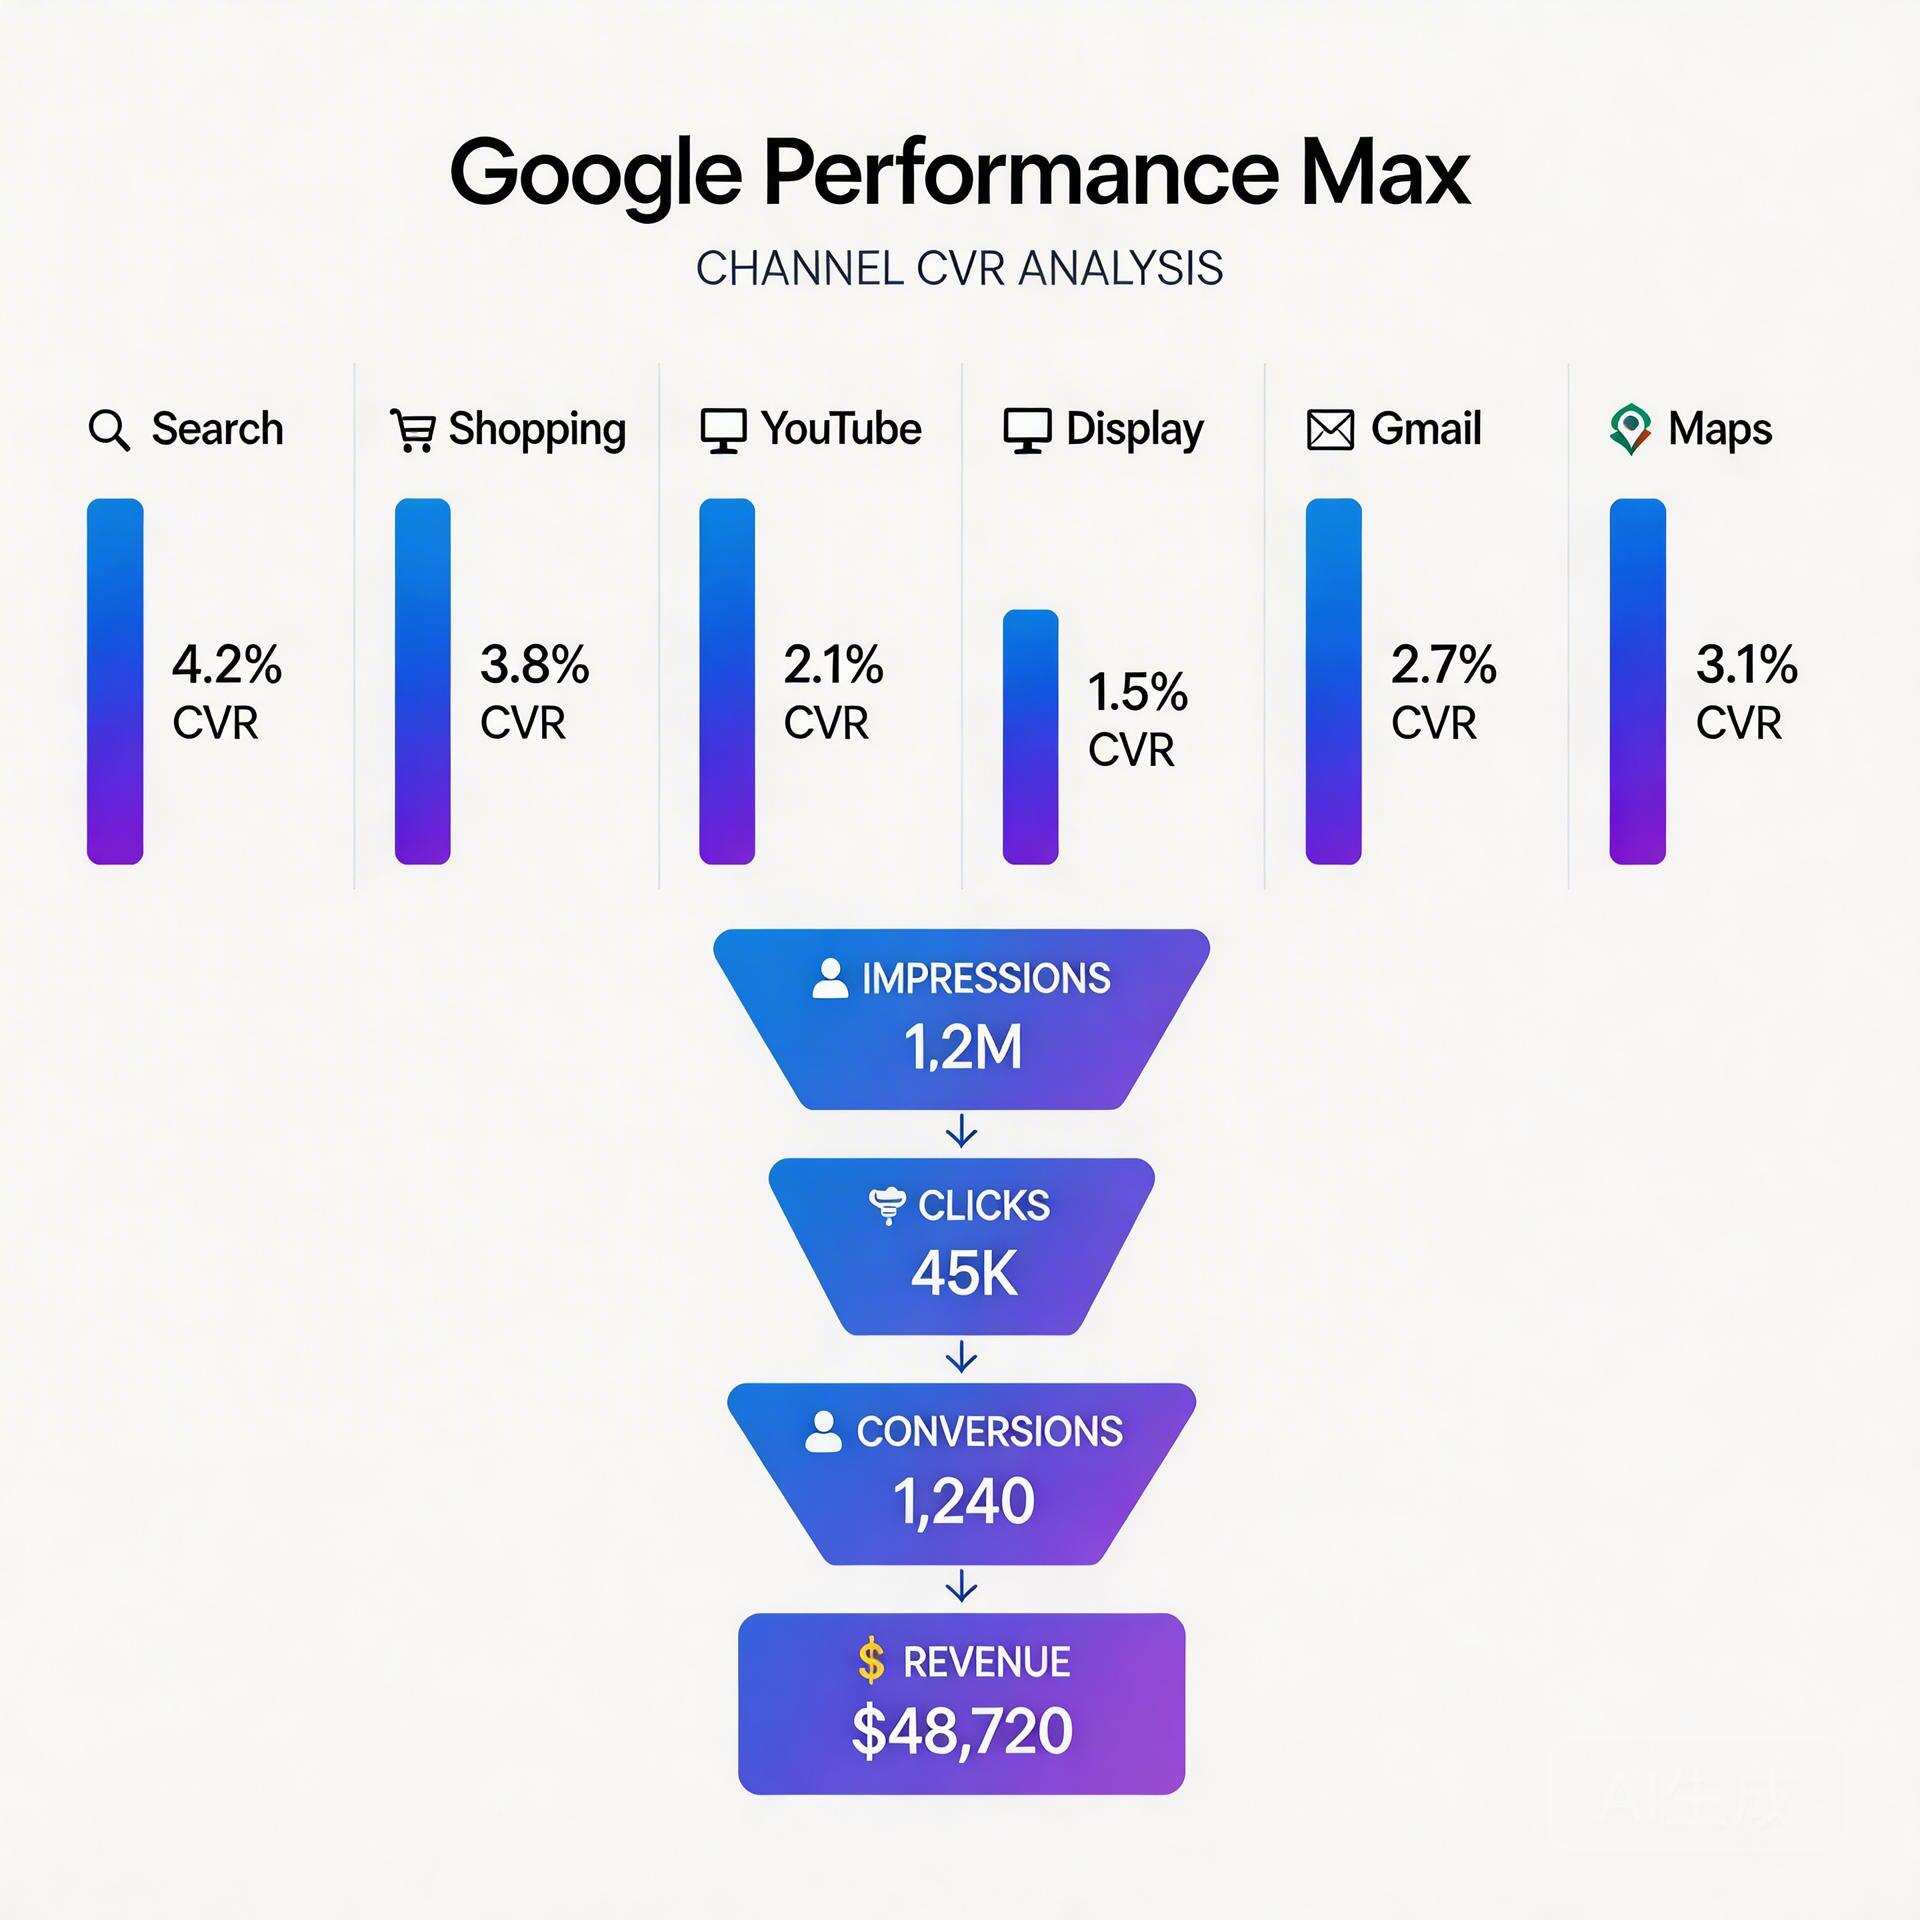
Performance Max consolidates budget across Search, Shopping, Display, YouTube, Gmail, and Maps. Google’s algorithm allocates spend dynamically — and until recently, advertisers had almost no channel-level data to work with.
In 2025–2026, Google rolled out expanded Asset Group Insights and the Channel Timeline view in the Campaigns tab. Here’s what this data actually tells you:
- Channel share over time: How your budget shifted between channels week-over-week as the algorithm learned
- Impression vs. conversion contribution: Which channels are generating clicks but not conversions
- Asset performance by channel: Whether your video, image, or text assets are driving results in a specific environment
The critical insight from Q1 2026 PMax performance data: Display and Gmail channels consistently show 40–60% lower post-click conversion rates compared to Search and Shopping for the same campaign. Yet the algorithm routinely allocates 25–35% of budget to these lower-converting channels when volume targets are high.
Which PMax Channels Consistently Underperform on Post-Click CVR

Based on aggregated data from 200+ PMax campaigns analyzed through DeepClick’s post-click funnel tracking, here’s the channel CVR hierarchy:
| Channel | Average Post-Click CVR | Primary Drop-Off Stage |
|---|---|---|
| Search | 3.2–5.8% | Form abandonment |
| Shopping | 2.8–4.5% | Checkout friction |
| YouTube | 1.1–2.3% | First 5-second engagement |
| Display | 0.4–1.2% | Bounce within 10 seconds |
| Gmail | 0.6–1.5% | CTA visibility on mobile |
| Maps | 2.1–3.4% | Direction vs. web action split |
The problem isn’t just that Display and Gmail convert less — it’s that they convert less while receiving budget that could go to higher-intent channels. When your PMax campaign ROAS drops, the channel timeline view will often show a spike in Display/Gmail spend that coincides with the ROAS decline.
How to Identify Low-Performing Channels in PMax (Step-by-Step)
Google doesn’t give you direct channel-level conversion data in a single report. You need to triangulate from three sources:
Step 1: Export the Asset Group Performance Report
In Google Ads, navigate to your PMax campaign → Asset Groups → Columns → Add “Conversions,” “Cost per conversion,” and “Conversion value.” Sort by cost descending. Asset groups running primarily on Display will show dramatically higher cost-per-conversion.
Cross-reference with the Asset Group Audience signal insights to see which audience segments are driving spend — Display-heavy asset groups often correlate with broad audience signals with low purchase intent.
Step 2: Use the Search Terms Report as a Proxy
PMax’s search terms report (available under Insights tab) shows which search queries are triggering your campaign. High-volume, low-intent queries (broad informational terms) indicate your PMax is spending heavily on Search Network placements that attract early-funnel traffic.
If your search terms report is dominated by informational queries while your Shopping placements perform well, add negative keywords at the campaign level to suppress non-converting search placements.
Step 3: Segment by Time and Channel Share in Reports
Download weekly performance data and cross-reference spend distribution with conversion rate changes. Periods of high Display/Gmail allocation consistently correlate with lower ROAS in most verticals except brand awareness campaigns.
For AI social app campaigns and BC gaming campaigns specifically, this correlation is even stronger — users clicking Display ads are typically not in a conversion-ready mindset, making the post-click funnel almost impossible to optimize at the landing page level alone.
Why Post-Click Optimization Is the Channel-Agnostic Fix
Here’s the uncomfortable truth about PMax channel optimization: you have limited direct control over budget allocation by channel. Google’s algorithm allocates budget where it predicts conversions — but it’s optimizing for its prediction of your conversion signal, not for your actual post-click funnel health.
This creates a structural gap. If your landing page converts poorly for Display traffic (high bounce, low time-on-page, no re-engagement signal), the algorithm reads this as “Display doesn’t convert for this campaign” and reduces Display allocation — but it may simultaneously misread the signal and cut YouTube spend that could have worked with better post-click handling.
The solution is to fix the post-click funnel so that even lower-intent traffic converts at acceptable rates:
- Re-engagement sequences: Users who click Display ads and bounce within 30 seconds are identified, not lost. A structured re-engagement flow (push notification, email capture at scroll depth, or retargeting pixel activation) can recover 15–25% of these clicks at near-zero additional acquisition cost.
- Channel-matched landing page variants: Display traffic and Search traffic come with different intent signals. A Display click needs more context and social proof than a Shopping click from someone actively searching for your product. Creating channel-matched landing variants consistently lifts overall campaign CVR by 18–30%.
- Post-click link optimization: Slow-loading landing pages kill post-click conversions disproportionately on mobile Display traffic. Every 100ms of additional load time reduces mobile conversion rate by approximately 1% on Display placements.
This approach is also detailed in our comprehensive guide on Meta ads post-click optimization — the same framework applies across paid channels including PMax.
PMax-Specific Post-Click Fixes by Channel Type
For Display-Heavy Spend
- Implement an exit-intent capture on your landing page to convert high-bounce Display traffic into a re-engagement audience
- Add social proof elements above the fold specifically for cold audiences — testimonials, review counts, and risk reducers
- Create micro-conversion events (video plays, scroll depth, tool interactions) that give PMax’s algorithm better optimization signals than a single purchase event
For YouTube Underperformance
- Ensure your landing page matches the visual language of your video ad — creative-to-page consistency is the single highest-impact change for YouTube post-click CVR
- Add a dedicated YouTube landing page variant with a bridge section connecting the video content to your offer
- Set up View-Through Conversion windows and compare VTC vs. click-through rates to understand YouTube’s true funnel contribution
For Gmail Conversion Issues
- Gmail ad clicks are often from mobile users checking email quickly — your landing page needs a single, highly visible CTA above the fold with no distracting navigation
- Reduce form fields to the absolute minimum for Gmail-originated traffic
- Test SMS/WhatsApp opt-in as an alternative conversion for Gmail traffic, which typically converts 2–3x better than form submissions from this channel
For teams scaling budget while managing funnel health, the framework in our budget scaling and post-click funnel guide maps directly to PMax campaign signal optimization.
Setting Up Channel-Level CVR Monitoring
- GA4 Source/Medium Segmentation: Tag your PMax landing pages with UTM parameters differentiated by asset group. This allows GA4 to show post-click behavior (session duration, pages per session, conversion rate) by effective channel.
- Post-Click Funnel Tracking: Instrument micro-conversions at each funnel stage — page engagement (30s+ session), CTA scroll depth, form start, form complete. This gives PMax’s algorithm better optimization signals.
- Weekly CVR Audit: Every Monday, review asset group performance. Flag any group with CPA more than 2x your target — this signals a channel shift degrading post-click performance.
- Lead quality scoring: For lead-gen campaigns, use the framework in our lead quality scoring guide to ensure PMax is optimizing for SQL-ready leads, not just form fills.
Action Checklist: PMax Post-Click CVR Recovery
- ☐ Export Asset Group performance report — flag groups with CPA > 2x target
- ☐ Check search terms report for informational query volume — add negatives if >30% of spend
- ☐ Audit landing page load speed on mobile (target: <2s LCP)
- ☐ Create separate landing page variants for Display/YouTube vs. Search/Shopping traffic
- ☐ Implement exit-intent capture or micro-conversion events for lower-intent channels
- ☐ Set up re-engagement automation for users who bounced within 30 seconds
- ☐ Add UTM-level tracking by asset group to GA4
- ☐ Schedule weekly CVR review — track channel distribution changes vs. CVR impact
PMax channel CVR analysis is not a one-time fix — it’s an ongoing optimization loop. The algorithm will continue to shift budget, and your post-click funnel needs to remain channel-matched to maintain performance as spend distribution evolves across your campaign lifecycle.
Stop losing conversions after the click.
DeepClick helps Meta advertisers fix post-click drop-offs and improve CVR by 30%+ through automated re-engagement and post-click link optimization.
Leave a Reply